The landscape of public bitcoin mining operations has changed dramatically after a bearish 2022 with Chapter 11 bankruptcies, debt restructuring, and M&A. Only a handful of operations succeeded in growing their hashrate as scheduled without much debt or share dilution.
Although public market investors typically look at bitcoin mining stocks as a turbo-charged proxy of bitcoin itself, there are unique metrics in bitcoin mining that set one operation apart from others. While the commonly used financial metrics, such as working capital, gross margin, D/E, and P/E ratios are still useful, they are not enough.
This article summarizes six unique fundamentals in bitcoin mining that could help evaluate individual mining operations.
Realized Hashrate
As the bitcoin mining industry grows institutionalized, more market participants now disclose monthly bitcoin production results, which lays the groundwork for further analysis on top. The most straightforward metric there is the realized hashrate introduced by TheMinerMag.
In short, realized hashrate is the hashrate implied from a company’s monthly production, the bitcoin network’s total block rewards, and the network’s average hashrate in a month.
For instance, bitcoin’s total block reward in February 2023 was 26,907 BTC and the 28-day average network hashrate in the month was 297 EH/s. That means, on average, each EH/s in the month should be able to mine 90.5 BTC. In other words, if a company mined 90.5 BTC in the month, its realized hashrate was 1 EH/s.
Why does it matter? It puts every mining operation on the same scale over time by normalizing the changes in bitcoin’s network hashrate and block rewards every month. It gives a more accurate picture of a company’s position in competing for block rewards currently and over time – and more importantly, whether it has outgrown competitors.
The chart below summarizes the realized hashrate of almost all public mining companies and how they have grown over time. The higher the realized hashrate, the bigger share a company has on the bitcoin mining reward cake, and thus, higher revenue potential.
Realization Rate
Another useful metric for evaluating public mining operations is the realization rate, which is the share of their realized hashrate over their installed operational capacity.
For instance, if a company has installed and been operating 1.2 EH/s of equipment in February but only mined 90.5 BTC in the month with a realized hashrate of 1 EH/s, then it only had an effective realization rate of 83%.
In general, the higher the realization rate is, the better. That is because it shows to what extent a publicly listed mining operator has been able to maximize its installed hashing power for shareholders.
The chart below summarizes each company’s realization rate over time. An individual company’s realized hashrate and realization rate can also be found in the company’s category on TheMinerMag’s DATA section. Since the beginning of 2022, HIVE, CleanSpark, and Bitfarms have achieved the highest realization rate consistently.
When it comes to low realization rates, there could be many reasons. For example, power curtailment activities and unexpected site issues could cause downtime. Meanwhile, if an operator plugged in more mining equipment halfway through a month, it would report a higher installed hashrate at the end of the month. That leads to a low realization rate because of a higher denominator.
In a nutshell, a low realization rate in a single month may not be bad news per se, but it is undoubtedly an unhealthy sign if it keeps happening for consecutive months. That is also why the realization rate chart above displays the “Average” value by default before any monthly value.
Price-to-hash Ratio
Just like the price-to-earnings (P/E) ratio commonly used in evaluating public stocks, we have come up with the price-to-hash (P/H) ratio as a unique metric in bitcoin mining that can help investors estimate how much they are paying for each TH/s of realized hashrate. From an investor's perspective, this metric can be seen as how much one is paying for a mining company to mine bitcoin on one's behalf. Here is the calculation:
P/H ratio ($/TH/s) = Market Cap / Realized Hashrate
For instance, Marathon’s market capitalization as of March 8 was $711 million and its realized hashrate in February was 7.54 EH/s or 7.54 million TH/s. Hence its P/H ratio is about $94.39 per TH/s. From this perspective, buying a share of Mara's stock would mean one is paying Marathon $94/TH/s to mine bitcoin. Investors can then evaluate whether this is overpriced or underpriced in comparison to the cost per TH/s they would have to pay to mine bitcoin themselves including both CapEx and OpEx.
Just like the P/E ratio, a lower P/H ratio means an investor is paying less money for the worth of one TH/s in realized hashrate from a public mining company. The chart below captures the P/H ratio of public mining stocks with a market cap at least higher than $100 million.
Net-Debt-to-hash ratio
Similar to the concept of the P/H ratio, the Net-debt-to-hash (ND/H) ratio analyzed and visualized by TheMinerMag reflects how much net debt each TH/s of a company’s realized hashrate carries. Because bitcoin mining is an asset-heavy industry, many public mining companies have taken loans to fund their capital and operational expenditures so that they can turn investments into actual bitcoin production.
Net debt is the worth of the total liabilities of a company after subtracting cash and cash equivalent. For instance, CleanSpark’s net debt as of Dec. 31 was $53.8 million. Its average realized hashrate throughout Q4’22 was 4.58 EH/s, or 4.58 million TH/s. Hence its ND/H ratio was $11.7/TH/s.
A lower ND/H ratio means a mining company has taken less leverage to grow its realized hashrate and hence is less exposed to market risks and volatility. The chart below captures how each public mining operation is doing in terms of realizing hashrate through leverage over time.
Cost of Bitcoin Production
Just like any publicly listed company, bitcoin mining operations must disclose the cost of revenue as part of their financial income statements. The cost of bitcoin production analyzed and visualized by TheMinerMag takes each company’s cost of revenue for the proprietary mining segment and divides it over the amount of BTC mined during a quarter.
A company’s cost of revenue in the proprietary mining segment typically includes energy costs, which take up the most part, as well as other necessary site maintenance expenses. There are two most important factors determining a company’s cost of bitcoin production: the energy rates and mining fleet efficiency. In short, the lower the cost of bitcoin production, the better.
Depending on the business model, companies have different financial reporting styles. Some include the depreciation and amortization expenses as part of their cost of revenues but others do not. TheMinerMag’s data and analysis have removed the impact of depreciation because such expenses are not cash-based.
In addition, TheMinerMag’s methodology for analyzing the cost of bitcoin production across public mining firms over time removes non-recurring factors so that it is as much of an apple-to-apple comparison as possible. Such non-recurring factors, for example, could be power credits received from curtailment activities that do not always happen every quarter.
All-in Cost of Mining
(UPDATE: TheMinerMag replaced this with the Hashcost metric in December 2023)
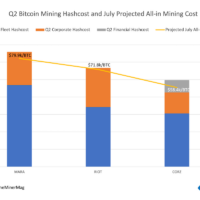
While the cost of bitcoin production captures the direct costs of proprietary mining activities, the all-in cost of mining analyzed by TheMinerMag takes an extra step by stacking corporate overhead and financial expenses on top.
Some public mining companies disclose the bulk of corporate overhead as Selling, General, and Administrative (SG&A) cost on their income statements. Such a cost can include a variety of items, such as executive payments, office expenses, employee payrolls and benefits, professional fees, insurance, R&D, etc. Some provide a more detailed cost breakdown of each item while some only disclose a lump sum SG&A.
Dividing the corporate overhead cost over the amount of BTC mined offers additional color on how much a company is paying to keep the office and team running and whether it is able to generate meaningful net profits for shareholders. TheMinerMag’s analysis of corporate overhead per BTC excludes share-based compensations because those are not cash-based.
For companies that have a diversified business model, TheMinerMag’s analysis takes a fair share approach to estimate the corporate overhead for the self-mining segment specifically.
Similarly, the interest expense per BTC captures the cost of loans and financial leases that a company is paying to sustain or expand its bitcoin mining operations.
One interesting observation is that the companies with low costs of bitcoin production do not necessarily have a low all-in cost of mining because they may have a larger team, they may overpay their executive teams, or they are simply taking too much leverage.
TheMinerMag visualizes the all-in cost of mining in two ways:
1) A horizontal comparison of all companies each quarter
(UPDATE: TheMinerMag replaced this with the Hashcost metric in December 2023)
2) A vertical breakdown of each company’s all-in cost of mining by quarter, such as the one focusing on Iris Energy as follows:
(UPDATE: TheMinerMag replaced this with the Hashcost metric in December 2023)
Conclusion
All the metrics above (as well as many other useful data points) can be found in the DATA section of TheMinerMag.
While there is no best metric in determining whether a mining stock is over or under-evaluated, the purpose of the dashboard is to help the public be better informed on a mix of variances that can be telling of the health of a publicly listed mining operation, especially in a bearish market.







Share This Post: